My personal performance #30daysoftesting challenge days 20 to 31
What time is it? Game time! Well, almost, it’s time for the latest #30daysoftesting challenge. Again organized by ministry of testing, this time with some support of the PerfGuild. Which leads us to the topic of this challenge: performance testing. Instead of posting a blogpost afterwards, I decided to start one right from the beginning and keep on updating it while doing the challenge. And as things are getting rather long, I decided to split the one post into 3 smaller ones.
My personal performance #30daysoftesting challenge days 1-9
My personal performance #30daysoftesting challenge days 10-19
My personal performance #30daysoftesting challenge days 20-31 (this one)
Day 20: Explore the difference between causation and correlation
Did you know that the shrinking number of pirates is the real reason for global warning? Regardless if your answer is yes or no, I urge you to read this first. Another example that stuck with me was the one I was taught in my statistics class at university. You all know the folk tale of the stork bringing the babies. Well, there is statistic evidence for Germany that the number of birth declines as well as the number of storks living here since the begin of the 19th century. There is statistical correlation between those two numbers. That does not mean, though, that one causes the other. You may need to consider that both are equally caused by something different. In this case it is industrialization and urbanization, which on the one hand destroyed the habitat of the bird and on the other hand lead to families getting smaller and smaller. Of course correlation can be totally coincidentally as well. So don’t fall for the fallacy that correlation implies causation.
Day 21: Share you favourite performance testing tool and why
Hm, to have a favourite one, I’d have to know more of these in-depth. The ones I know at least slightly are jMeter and artillery from the day 14 challenge. If I’d have to choose between those two I’d go for jMeter just because I felt a bit more comfortable with it in a short time. But that’s not really what you what call a sophisticated decision, but more of a gut feeling.
Day 22: Try an online performance testing tool
I had https://www.webpagetest.org/ have a look at this blog, which is an open source project aimed at making the web faster.
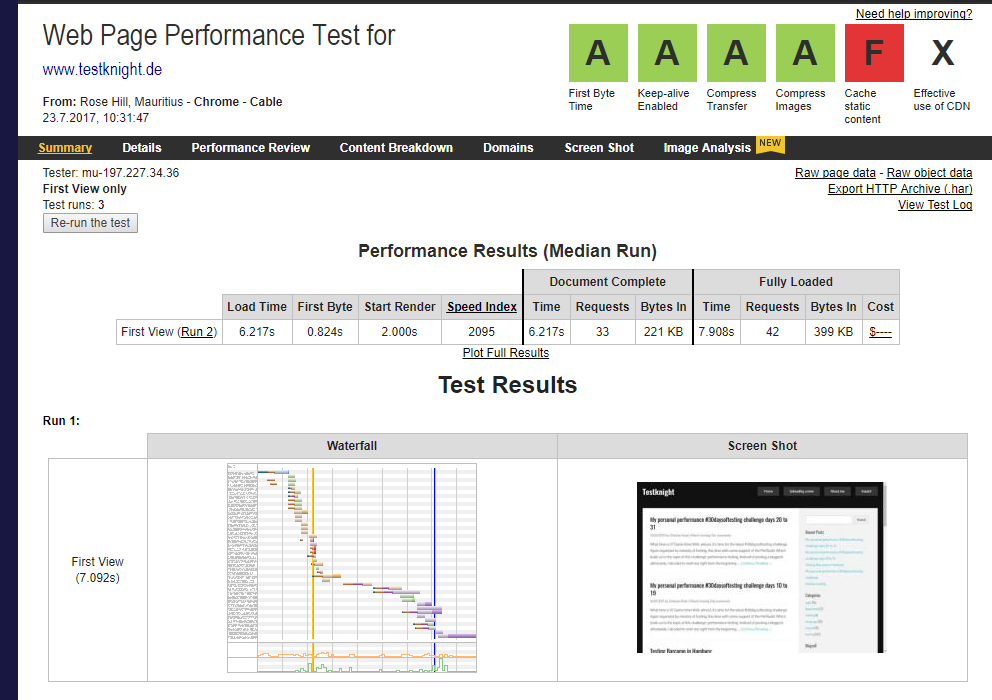
So, what did I get out of this except for the flag of Mauritius finally turning up on the wordpress country map? As you can see, there are some grades provided as well and it seems that the blog is doing mostly fine, except for caching, so that is something I will probably have a look at. Additionally I found the load time of over 6 seconds a little bit surprising, so I ran another one, but chose Germany as viewing location, which was considerably faster.
I like the tool overall and it provides some nice combination of raw data for you to interprete and some already provided interpretation, so it’s up to you to draw your own conclusions.
Day 23: Calculate the basic statistics for our response time results
How come the challenges where I could need some data from work are always due on weekends? Furthermore, I think this challenge is a bit vague:
so, what’s basic statistics anyway? #30daysoftesting #day23
— Christian Kram (@chr_kram) July 23, 2017
I decided to go for these:
- arithmetic mean
- standard deviation
- P80 percentile
The arithmetic mean is the average I am interested in, the standard deviation tells me how much variation there is and the p80 percentile gives me a threshold that is met by 80% of all responses.
For a sample I took the response times provided by the tool presented in the day 23 challenge, which I let run from 4 different locations, 3 times each, which makes for a sample size of 12. Those of you who are a bit in statistics will cringe now, as this sample is way too small for any valid conclusions, but it will do for showing what I did.
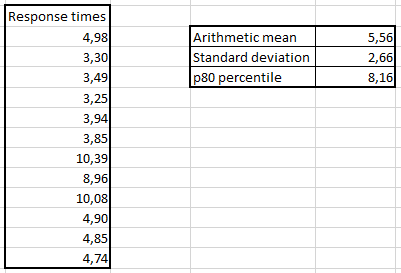
So how to interprete this? On average the response time was 5,56 seconds and all response times on average deviated 2,66 seconds from this average. Of course there were longer response times and that’s were the 80% percentile comes into play. The prediction is that 80% of all future responses will be faster than 8,16 seconds based on the data provided so far (which is pretty small and therefore not too suitable, but anyway). I won’t describe the calculations here, as I didn’t do them, but simply relied on those nice functions Excel provides anyway.
Day 24: Do you know what caused the last huge spike in your application’s performance?
They are talking about you, updated external driver! #30daysoftesting #day24
— Christian Kram (@chr_kram) July 24, 2017
It was the update of an external driver that caused us some trouble. So don’t just look at the changes you introduced to the system, but also at externally provided changes.
Day 25: Share three benefits of monitoring your application in production
#day25 #30daysoftesting
#1 actual user scenarios
#2 no scaling errors
#3 no “works on my machine” excuse— Christian Kram (@chr_kram) July 25, 2017
1. Performance testing gets more reliable when going for real user scenarios. Well, you can’t beat the real thing, so that’s certainly an advantage there. Even if you get the scenario functionally right, capturing speed and rythm is another thing you get on top here.
2. This takes challenge 26 ahead. More often than not test environments do not possess the same hardware specs than the production environment. Things don’t scale linearly I’ve been told, so the validity is somewhat lower. This is something you don’t have to bother with either when monitoring in production.
3. If a problem occurs on production, it directly affects, so no dreadful discussions on the system you are testing on. It’s already out there, so you better do something quickly!
Despite these advantages, I personally wouldn’t go for monitoring alone. While it certainly has some advantages, I’d always try to do some testing as well, as for example exposing the system to different workloads models, which I wouldn’t intentionally do on production in order not to get into people’s way (a.k.a. daily work) and to have a better chance of comparing different baselines.
Day 26: Explore the differences between your production and testing environment, could they impact performance testing
I am struggling a bit to give a concise answer to this for the reasons described in the day 11 challenge. I’d expect some differences, though, as described in challenge 25. Nice reading scavenger hunt, isn’t it? 😉
Day 27: How do you share your performance testing results with your team?
So far not I a systematic way, it’s more of “let’s mentioned it at the daily stand-up if something happens”. Yes, there is way for improvement. We had a brainstorming session recently about providing condensed information about the current development state on a dashboard to be shown on a screen on the aisle so that teams and people coming by can have a look at it. So if that’s something we will do, I’d like to be performance part of it.
Day 28: Design, draw and share your ideal performance dashboard
I spent 7 hours on the highway today, so I rather went with the design part. Drawing while driving isn’t the mother of all ideas I guess. I had some nice ideas and a mental drawing ready, which I threw overboard the very moment I arrived at my brother-in-law as he had a Microsoft Hololens at his place. Exploring that was very exciting and my ideal dashboard would now be an augmented reality one which could be freely arranged in space and be used via eye-tracking and hand gestures 🙂
Day 29: Explore how service virtualization can assist with performance testing
I skipped this and spent a lovely day in the Netherlands with my family.
Day 30: Share some potential challenges with performance testing in the mobile/IoT space
Well, I guess we are not talking about 100 users touching a smartscreen at the same time. Without digging too deep on this (same reason as day 29), I’d say that external factors become more important, things like location (phone on a subway?) not just for functional testing, but performance as well. Funny example from that day: the hololens can’t distinguish between your hand doing gestures and other people’s hands doing gestures. We tested with 3 people doing gestures at the same time, which was handled quite well actually.
Day 31: Bonus! Check out the PerfGuild conference lineup!
I cheated on this somehow as I did this already a few days in advance and also listened to episode 160 of the testtalks podcast. The sad thing is that I won’t attend it, there are some talks that I am interested in, which makes it hard to pass, but that’s the way it is.
Day 32: Conclusion
Okay, there is no day 32 challenge. Still I’d like to give a short conclusion. The performance testing challenge was the second #30daysoftesting challenge I participated and actually held on through to the end, the first one being the initial challenge. I have not been too much into performance testing, so I felt it was a nice start to get some more insight into this topic and it really did. And this time I even finished the book from day 1 in time, although I did not read it as thoroughly as possible. I have quite some passages marked for further investigation, though. In general I found the more practical challenges to be harder, which might be due to the environment I am in, but I got some tremendous input on how to incorporate some things into my work. I also enjoyed reading the few blogs and regular tweets that were written, reading how other people reacted to the challenge was a very nice addition. So hats off to
My #30daysoftesting challenge is now complete. The past 30 days have been the most productive of my career so far https://t.co/ET2N6jqvWP
— Ali Hill (@ali_hill91) July 31, 2017
Dia31: checking the @perfguild excited for the agile and shift left topics!Awesome challenge! #30daysoftesting @ministryoftest @testingclub pic.twitter.com/TmtOUZFak0
— Señor Performo (@Srperf) August 1, 2017
#30daysoftesting #day31: Season Finale. #performance #testing @ministryoftest https://t.co/wGxhjo0cJb pic.twitter.com/Bs7udEJxGP
— Tony Jiménez (@ToneJR) July 31, 2017